Methods
The Model Factory
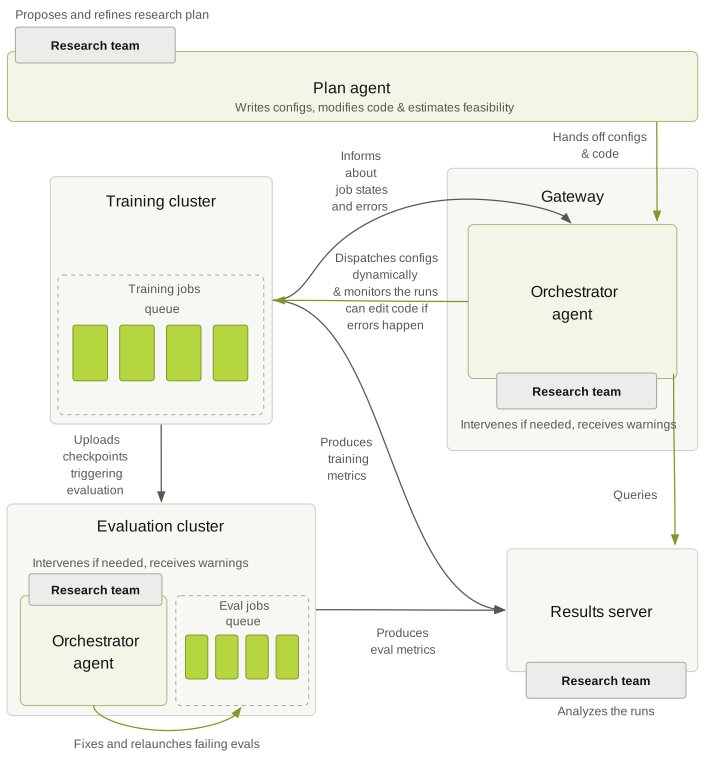
Botanic1 is developed through repeated experiments on training data, model architecture, and evaluation. Researchers define the questions; agents manage the experimental infrastructure.
The plan agent prepares configurations and code changes. An orchestrator dispatches and monitors training jobs, while a separate cluster evaluates the saved checkpoints. Researchers review the results and intervene throughout the process.
Pre-training data
The pipeline controls which genomes enter the corpus, how sequence windows are sampled within each genome, and which windows are retained. Each choice is evaluated at a fixed model size and training budget.
Window sampling. Sampling more functional regions improves downstream performance across the tested species pools. We use a 1:1 mixture of functional and other windows, retaining more unique sequence than a stronger functional bias.
Redundancy and species coverage. A MinHash threshold of 0.3 reduces repeated windows within each species. Genome-length correction also improves performance. Broadening the species pool retains performance on the crop-focused evaluation suite; phylogenetic weighting and N-content filtering do not show consistent gains.
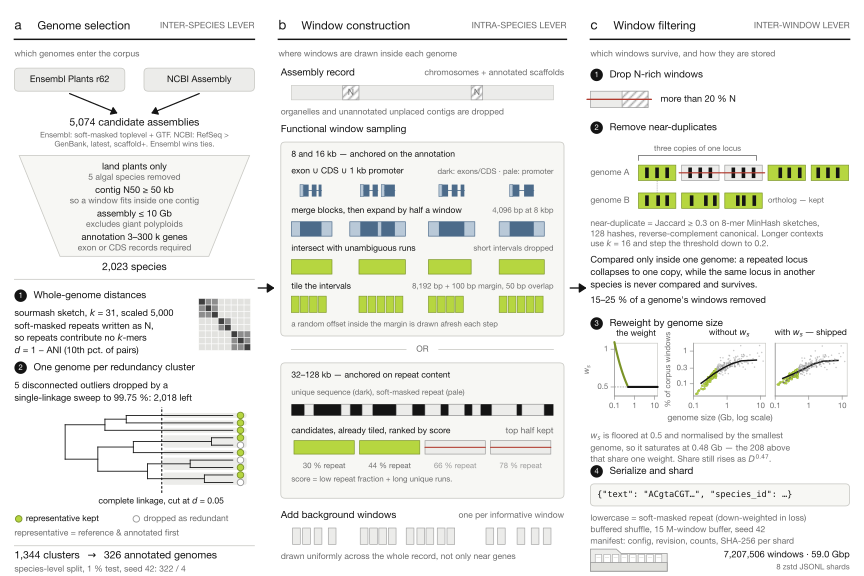
Genome selection controls redundancy between species. Window construction samples functional and background regions. Filtering removes ambiguous or redundant windows and adjusts representation by genome size.
Data ablations
The overview below shows the effect of each data choice. Select a row to inspect the individual comparisons and both seeds.
Inspect individual comparisons
Loading measured comparisons…
See the values for both seeds
| Other settings | Seed 42 | Seed 43 | Mean |
|---|
Each comparison uses a 300M-parameter model and two seeds, with matched optimiser steps, training tokens, and effective epochs. Seed ranges are not confidence intervals. The technical report gives the methods and limitations; the corpus page shows the resulting species mix.